Tuesday, 19 April 2016

Historical Trends in Parish BMD Register Entries

In a blog post of 14 January 2014 I commented on how certain events can be observed in an analysis of birth, marriage or burial records, particularly from entries in parish registers. That post dealt with a short term peak in marriages that occurred during the Interregnum (1649-1660) when marriages were decreed to be performed by Justices of the Peace in certain centres.

There are also long-terms trends evident in the parish records if one has such data summarized adequately. As an example, following are some observations of data from Plympton St. Mary and Plympton St. Maurice parishes in southwest Devon (Figure 1).

Entries in the registers of Plympton St. Mary parish are continuous from 1603 to 1982, so we have a great long-term view of births, marriage and deaths in the area. When combined with the 1616-1957 data from Plympton St. Maurice Parish we can see the statistical trends that cover the rural and urban areas around Plympton town. One should note that the numbers are only from Church of England records.
 
Figure 1 – index map to parishes in Southwest Devon
The more complete data for Plympton St. Mary parish (Figure 2) shows an early peak in baptism numbers around 1620 after which the number of baptisms dropped, with minor fluctuations, until about 1702 when the decline was arrested. From about 1668, and for many years through to the early 1720s, burials outnumbered baptisms, by almost 2,000 for the period, indicating a decline in overall population. Marriages declined in annual number slightly between 1603 and 1720. Numbers of baptisms rose after 1740 to a peak in 1862. They fell off again until the 1930s when rates climbed again. Following the Second World War there was an explosion in numbers, the beginning of the Baby Boom. Baptisms mostly exceeded burials in Plympton St. Mary parish throughout 19th Century, indicating population growth. With few exceptions, marriages were fairly constant throughout the 1600s, 1700s and 1800s and did not begin to rise significantly until the 1920s.
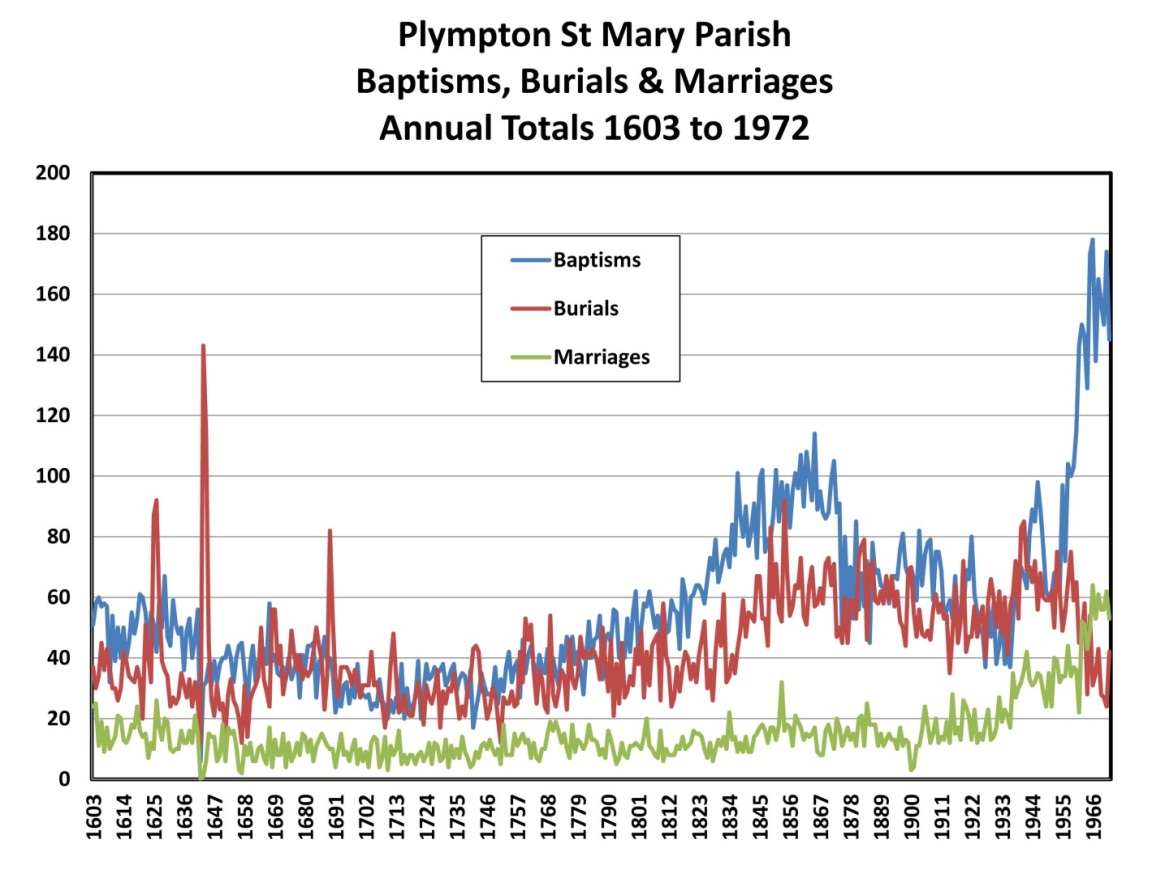
 
Figure 2 – annual baptisms, marriages and burials as recorded in the Church of England registers of Plympton St. Mary Parish – 1603 to 1972
The trends are slightly less pronounced for Plympton St. Maurice (Figure 3), mainly because it is a much smaller parish. It is almost wholly urban in character and probably experienced much inflow and outflow of individuals and families. Through the 17th and 18th centuries, baptism and burial numbers were almost in lock-step indicating a stable town population with little or no growth. The steady drop in numbers of baptisms, however, shows that overall population was probably in decline. The last peak in baptisms happened in the latter part of the 19th century. A decline in the number of baptisms continued into the early 20th century. Burials also increased in the early 1800s, peaking earlier than for baptisms, but then dropped as the 19th Century closed. Burials once again steadily rose during the 1900s. Interestingly, marriage numbers increased from the late 1880s even while baptisms declined.
 
Figure 3 – annual baptisms, marriages and burials as recorded in the Church of England registers of Plympton St. Maurice Parish – 1616 to 1957
The trends for both Plympton St. Mary and Plympton St. Maurice parishes, when combining rural and urban areas around Plympton Town (Figure 4), are somewhat clearer. Baptisms peaked sharply in 1865 and burials in 1883. In the previous two centuries, baptisms had steadily declined from a peak in 1629. The trend was not reversed until the 1740s. Burial numbers lagged baptisms until the 1640s. Thereafter they generally matched each other in number, until the late 1700s. Marriages were fairly steady throughout the 18th century, grew steadily during the 1800s and then rapidly increased beginning in the early 1900s.
 
Figure 4 – annual baptisms, marriages and burials as recorded in the Church of England registers of Plympton St. Mary and Plympton St. Maurice Parishes – 1603 to 1957
In contrast to the observed major decline in baptisms in these two parish during the latter part of the 19th Century, the population of the region actually increased (Figure 5); so what was the reason the Church of England events dropped in number? One explanation may be that, after the introduction of mandated civil registration in 1837, the importance of the Church as the repository of vital statistics data waned. Perhaps society developed along more secular lines, reducing the influence and meaning of religious services and, in particular, the Church of England. It may also be that non-conformist institutions assumed a more important role in baptisms, marriages and burials as regulations and laws affecting them were relaxed and larger numbers of people moved toward these churches.

Or, perhaps, other influences were in play, some of which we might surmise and some we have yet to determine.
 
Figure 5 – population of combined Plympton St. Mary and Plympton St. Maurice Parishes, 1801 to 2001 (Data is from Online Historical Population Reports and the UK Office of National Statistics. No census was taken in 1941.)
When the annual numbers for baptisms, marriages and burials are plotted over long periods of time, as seen here, many trends are apparent, with numbers increasing or decreasing in regular patterns. Individual anomalies also stand out, in the form of sharp spikes or troughs. Both are an indication of change in population and a reflection of specific events that unfolded in the communities. Recognizing these trends may give us better ideas about how changes were playing out in local communities which, of course, affected any ancestors who may have lived there at the time.

In my next post I will offer some comments on the contrast between church and civil records and what conclusions might be derived from the statistical analyses.


Wayne Shepheard is a volunteer with the Online Parish Clerk program in England, handling four parishes in Devon, England. He has published a number of articles about various aspects of genealogy and is the Editor of Relatively Speaking, the quarterly journal of the Alberta Genealogical Society. Wayne also provides genealogical consulting services through his business, Family History Facilitated.

Tuesday, 12 April 2016

Etcetera, Etcetera, Etcetera!

No, this is not about the King of Siam who used the phrase frequently when under the tutelage of his English schoolmistress. It’s about the word, or most often the abbreviation we have taken for granted forever in expressing an ongoing list of things when we write or speak.

Many people, outside of those who do a lot of transcribing of old English documents, might not know it has been a part of the English language for centuries and was often written with the ampersand symbol. Reading old documents one will commonly come across both & and &c. Etcetera was originally a Latin phrase, “et”. The ampersand itself means “and” which when written in front of “et” or “c.” – as a ligature – would mean “and other things” and pronounced as etcetera. Simple enough!

The ampersand was at one time considered the 27th letter of the English alphabet, placed at the end after ‘z’. It was described as “and per se & (and)”.
 
From the 1788 book titled, Court-Hand Restored by Andrew Wright.
The symbol has taken many forms over the years as well as being used in most languages in Europe, having come from Latin roots. Its development is described in a book by Jan Tschichold, Formenwandlungen der ET-Zeichen (The Ampersand: Its origin and development); publisher: Woudhuysen, 1957.
 
One of the diagrams showing the forms of the ampersand symbol over the years (Tschichold, 1957)
In old documents, it can be found written in several ways, separately or as part of etcetera. BMD registers most often use the abbreviations.
 
1660 St. Clement Danes parish, Middlesex baptism register example
1660 Whitchurch parish, Shropshire baptism register example
1664 Acle Parish, Norfolk, marriage register example


1709 Cornwood parish, Devon marriage register example
This is just one of many interesting symbols and letter styles found in old records. North American documents from the 17th to the 19th centuries are very similar to those of England and generally will have the same writing style.

I’ll look at other Old English writing example in later posts. In the meantime, readers may wish to reacquaint themselves with a post from 5 August 2014 on Reading Old English.


Wayne Shepheard is a volunteer with the Online Parish Clerk program in England, handling four parishes in Devon, England. He has published a number of articles about various aspects of genealogy and is the Editor of Relatively Speaking, the quarterly journal of the Alberta Genealogical Society. Wayne also provides genealogical consulting services through his business, Family History Facilitated.

Tuesday, 5 April 2016

What will we do with future photos?

A Bizarro cartoon in the paper the other day got me thinking about photos. I have written before about the old photographs I have, taken by family members and how prized they are. Other genealogists have also commented on their pride in having original photos or copies of photos that go well back into the 1800s. They give us a glimpse of the lives led by past generations and tangible exhibits of people related to us that we can compare ourselves with.

Anyway, the cartoon showed a grandmother sometime in the mid-21st century holding a cell phone and asking her granddaughter if she would “Care to see pictures of every meal I’ve ordered in a restaurant in the past 45 years?” It was cute and funny but also got me wondering what the heck are people going to do with pictures taken now and in the future. Few people in my family use or even have photo albums any more that have actual prints stored in them.

I am just in the process of redoing many of our old family albums that have images going back to 1875. My daughter says she wants all the albums we assembled when she was growing up (and after as well) because they record her history and, like me, she is a bit of a pack-rat. I am now filling album number 60. And I have a few more for major holiday trips taken as well and, of course, the various wedding albums. I am sure she will welcome and look after the albums containing pictures taken or originally owned by my parents, grandparents and great-grandparents, too. Maybe one or two of my grandchildren might get curious in the future and take them over. I do worry about that sometimes – what will happen to all the family memorabilia, including photographs when I am gone.
 
The Old and the New: top – one of the old albums belonging to me parents (I put it together as well back in the 1960s); bottom – one of the new, leather-bound albums with protective sheets containing the oldest family photos
Our Family Albums – now numbering 60, plus a few miscellaneous, specialty albums, containing pictures of our family from the time we were married.
Anyway, back to the future. What on Earth will happen to photos being taken today and in the future? Who will care? Who will have time to even look at them? Will genealogy programs even have space to add photos or will they need links to social media pages?

There are many reports and studies on the history of photography and on modern statistics of picture-taking. The first photographs were taken less than 200 years ago. Depending on who you read, about 3.5 trillion photos have been taken since then. More than 380 billion, as of 2011, were being added every year! The largest photo repository is now Facebook. (as described by Amy Hobbs on 12 March 2012 – How  Many Photos Have Ever Been Taken?)
 
Graph showing number of photographs taken by year since the invention of the daguerreotype in 1874 (from Amy Hobbs, Fstoppers website)
A later report published on the Resource website, estimated that over a trillion photos would be taken in 2015. (described by Jaron Schneider on 12 December 2014 – Infographic: There will be one trillion photos taken in 2015) That’s a lot of photo albums!
 
Estimate of the number of photographs that will be taken in future years (from Resource website)
Adding photos to family trees will get increasingly more difficult, even as the availability of digital images becomes easier. I have a hard time believing that anyone will have the time to sort through the thousands of pictures of varying quality to choose which ones best portray those individual family members. And I am sure I won’t be able to fit anywhere near the number of pictures even my own children will take on my Legacy Family Tree program.

Many writers have commented on the future demise of family history software, at least of the type I have on my computer, and predict that future genealogist will put everything in the cloud. Maybe some version of Facebook will be designed especially for family trees so that all those thousands of pictures taken by family members in future years can be stored there for their descendants, along with their personal histories.

All that assumes that people will even want to pore through the images on their computer or hand-held device. My children, and grandchildren still, on occasion, love to take down the old binders and put their fingers on actual prints.


Wayne Shepheard is a volunteer with the Online Parish Clerk program in England, handling four parishes in Devon, England. He has published a number of articles about various aspects of genealogy and is the Editor of Relatively Speaking, the quarterly journal of the Alberta Genealogical Society. Wayne also provides genealogical consulting services through his business, Family History Facilitated.